April 5, 2017 javascript runtime coverage chrome devtools dynamic analysis code splitting bundling performance

JavaScript and CSS code coverage has arrived in Chrome Canary. It was previously under an experimental feature switch. This post will look at what it does, how to use it, and what you can do with the data it provides, in order to improve app performance.
The feature uses dynamic analysis to provide runtime code coverage statistics. Dynamic analysis is the process of running an application and gathering data during the execution of the code. In this case, the coverage is gathered at runtime by flagging the code that has been executed.
As well as JavaScript, it can tell you what CSS selectors have been used.
Using the Coverage tool
Before we look at the real benefits of this tool, let’s take a quick look at how to use it to gather this data.
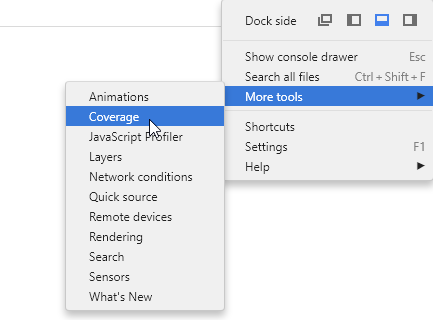
- Open up DevTools in Chrome Canary and switch to the Coverage tab.
- Similar to the Timeline tab, now renamed Performance, you have a button to capture the data. Clicking this will start the recording process. The stats are shown after clicking the stop button.
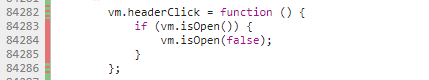
- Click on the script URL to open it up in the Sources panel. The lines will be decorated with a green/red bar to indicate whether the line was executed or not during this recorded session.
The reason DevTools requires you to record this data yourself is due to the instrumentation process of dynamic analysis. The code that gets run is decorated with functions that capture additional data. Therefore, more code is executed than your raw app.
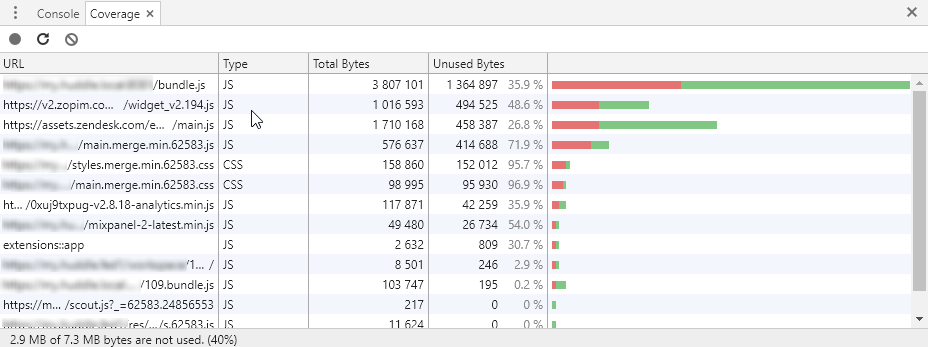
The resulting table shows the script and CSS files loaded during the recorded session, and the number of bytes of data downloaded that were unused. The total aggregated usage is shown in the status bar.
NB: If you’re interested in learning a little about how this feature works behind the scenes, check out A quick look at how Chrome’s JavaScript code coverage feature works.
What do I do with this data?
If the percentage of unused bytes in your code is high, it suggests that the end user is having to download a lot more than is necessary to run your app, or the part of that app used at the current point in time. This can result in slow app startup times, or just page loads in general, particularly on slower connections. It can also potentially cause performance issues in browsers, due to increased memory consumption.
In the screenshot above, you can see that the largest file is bundle.js, and 35.9% of it’s code is not even executed. That’s approximately 1.3 MB, which is quite significant.
There are at least three possible reasons for this:
Dead Code
You might be working on an old code base, which has gone through a fair number of changes over time. Some of the functions in your code may no longer be used, but you forgot to remove them.
The dynamic nature of JavaScript means you can’t simply remove the code that is ‘apparently’ unused, because it may well be executed after the user performs another action on the page. Any asynchronous code, for example, an event triggered or an AJAX request, will lead to callback functions that would otherwise not have been executed. You will need to check whether the code is actually going to be hit in all code paths, and remove where appropriate.
As well as the line decorations in the Coverage tab, if you use a BDD-style testing framework, such as Huddle’s PhantomFlow, you could follow the paths set up in the tests, and use them as a guide for removing dead code.
Webpack 2 introduced Tree shaking, which prevents a whole module’s code from being included in a bundle when only a subset of functions are imported from it. This goes a long way towards eliminating dead code in your app. However, my understanding is that unused functions on an object within one module will not be removed. The compiler is looking for import and export usage across modules. It’s also important to note that dead code remains in your project files, which is not a good way to maintain your codebase.
Delayed Code
Perhaps you have removed or ruled out the possibility of dead code, but your percentages are still quite high. Now what do you do?
As stated in the previous section, JavaScript is dynamic, and code may be executed later on. Why do you need all the code to download right now if it’s not all currently being used. Why not download parts of it when they become needed? This concept is sometimes referred to as Lazy Loading, and it simply involves including scripts conditionally, rather than having them all loaded at once.
Module bundlers like Webpack will take your scripts and bundle them all, by default, into a bundle.js file. (NB: The name is a convention, it can be anything you like). This can lead to a huge file that the user has to download in one go before they can effectively use your app.
Lazy Loading allows you to load scripts in your code when they are needed. I’m not going to explain how you configure your bundler to do this, as it very much dependent on your setup, but you can check out Code Splitting and bundle-loader as example techniques for details. The main thing to take from this is that separate script bundle files are generated, and bundles are only requested when they are needed.
By lazy loading different modules, you can reduce the size of your app entry point considerably. This will, of course, lead to better runtime coverage. However, it’s important to not micro-optimize. For small amounts of code, it’s not worth creating a separate chunk for it. There is an amount of latency involved when loading files, and if you have several chunks loading in one go, you should be aware that the browser is limited to, typically around 6-7 simultaneous requests at a time per host.
Third Party Code
Your app may be using a third party library, which brings in a large script file. One small improvement could be to delay the loading of the library until absolutely necessary. However, Tree shaking in Webpack 2, as mentioned earlier, could help significantly by eliminating functions from your bundle that weren’t ever imported. For example, you use one or two utility functions from a very large set. Other than that, there’s probably not much you can do, other than persuading the library maintainer(s) to minify and adopt the lazy loading approach.